


The ICL is a relatively new technology platform for developing sustainable communities that was launched by the leading performance analysis solutions vendor, IES, last year. Up until now, IES has been best known for its powerful IESVE suite of solutions focused on the in-depth performance analysis of individual buildings, allowing new buildings as well as retrofits to be designed to consume significantly less energy without sacrificing occupant comfort. With the ICL, short for “Intelligent Communities Lifecycle,” IES has expanded its expertise to larger groups of buildings such as campuses and neighborhoods. The idea is the same—to apply sustainable design concepts—but now to entire communities and not just individual buildings.
While the importance of applying sustainability principles to entire communities cannot be overstated in making any kind of progress towards energy goals such as AIA 2030 Commitment in the US and Net-Zero by 2050 in the UK, it is not just the increase in the scale of the problem—when compared with sustainable design for individual buildings—that is different. In most cases, the communities that need to be reconfigured to reduce their energy consumption already exist rather than being created from scratch. This requires a solution that can “read in” existing developments, monitor their energy use, and perform “what-if” analyses to study the impact of different kinds of interventions and scenarios to determine which ones work best in improving their energy performance. This makes the ICL much broader in scope, comprised of a collection of products rather than a single solution.
The ICL comprises of four main components for the modeling, monitoring, and analysis of a community to improve its energy performance (see Figure 1). These include iCD (Intelligent Community Design), a tool for creating the 3D model of the community and analyzing key environmental metrics such as solar potential, walkability, and resource consumption; iSCAN (Intelligent Control and Analysis), a tool for integrating performance data from multiple sources in the community, monitoring the data, and analyzing it to improve energy performance; iVN (Intelligent Virtual Network), a tool to analyze resource networks such as electricity, heating, cooling, and waste heat that could be used by energy engineers to optimize the energy grid for the community; and VE (Virtual Environment), IES’s flagship product, that can be used for the detailed design, analysis, and simulation of the individual buildings in the community.
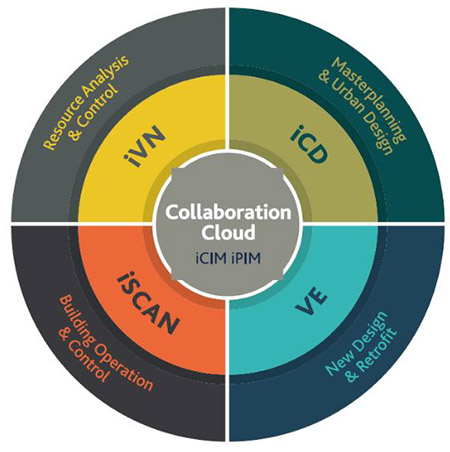
These four ICL tools can be used independently or integrated with each other. When used together, they are connected through a Collaboration Cloud, as shown in Figure 1, which is comprised of two tools for interacting with and collaborating on the ICL project: the iCIM (Intelligent Community Information Model), designed to be used for a single community; and iPIM (Intelligent Portfolio Information), designed to be used to visualize key performance indicators and data across multiple properties in a portfolio.
Let us look at some of these components in more detail.
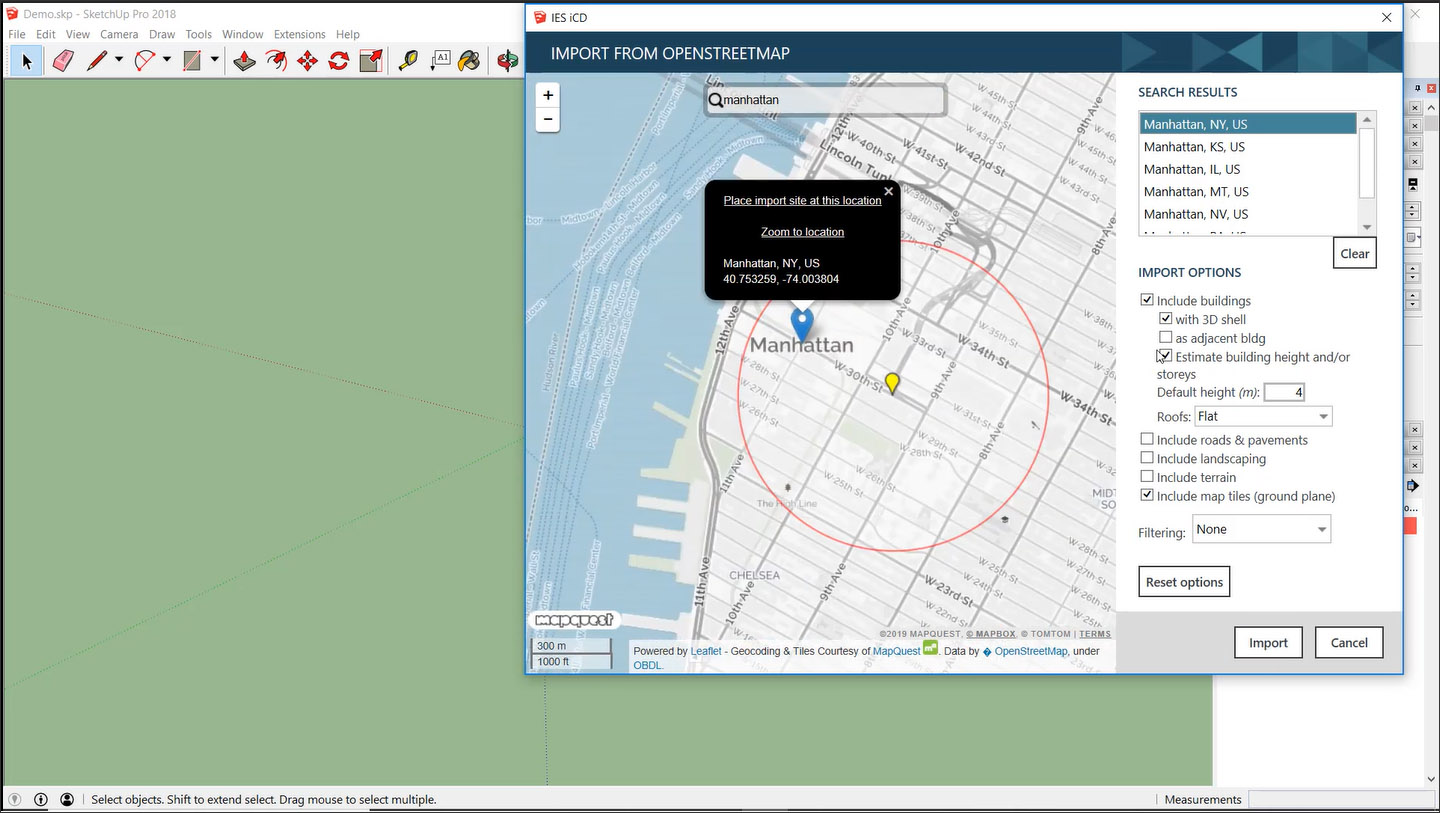
The ICD tool that is used to create the digital model of the project is a plug-in to SketchUp. The modeling can be jumpstarted by importing the data of the region from an open source such as Open Street Map (OSM), as shown in Figure 2. You simply select the area in the map that needs to be modeled and it is brought into SketchUp as a 3D model, with the ability to include the roads, landscaping, terrain, etc., for context and clarity The 2D map can be added to the 3D model as an underlay. While the building footprints would typically be included in the map from which the model is being created, you can specify a default height for buildings that do not have height information in the map. The quality of this initial model would depend upon how much information is available for that region in the map. For major cities like London, Manhattan, San Francisco, etc., the data is very rich, including accurate building heights, so the starting model is already very detailed, as shown in Figure 2.
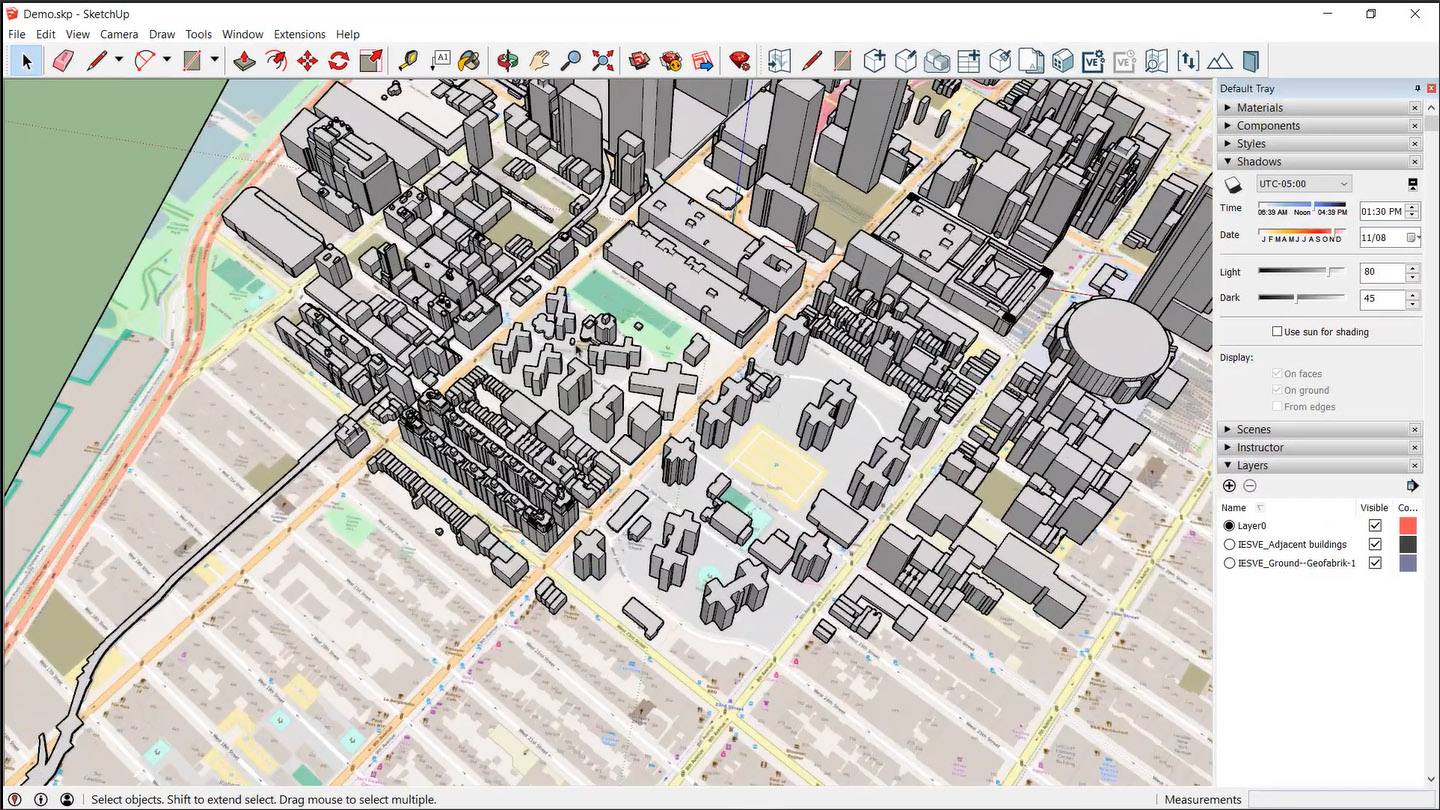
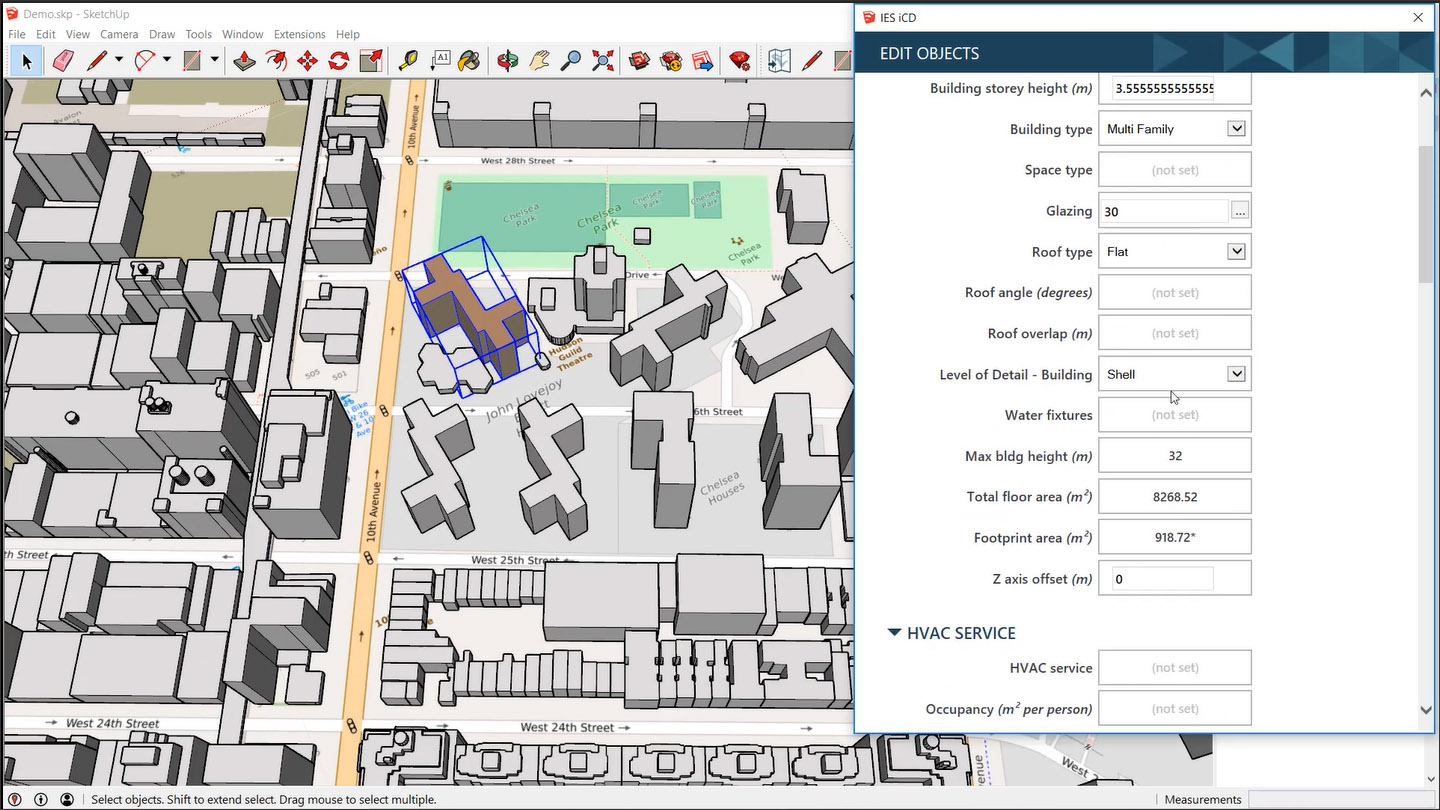
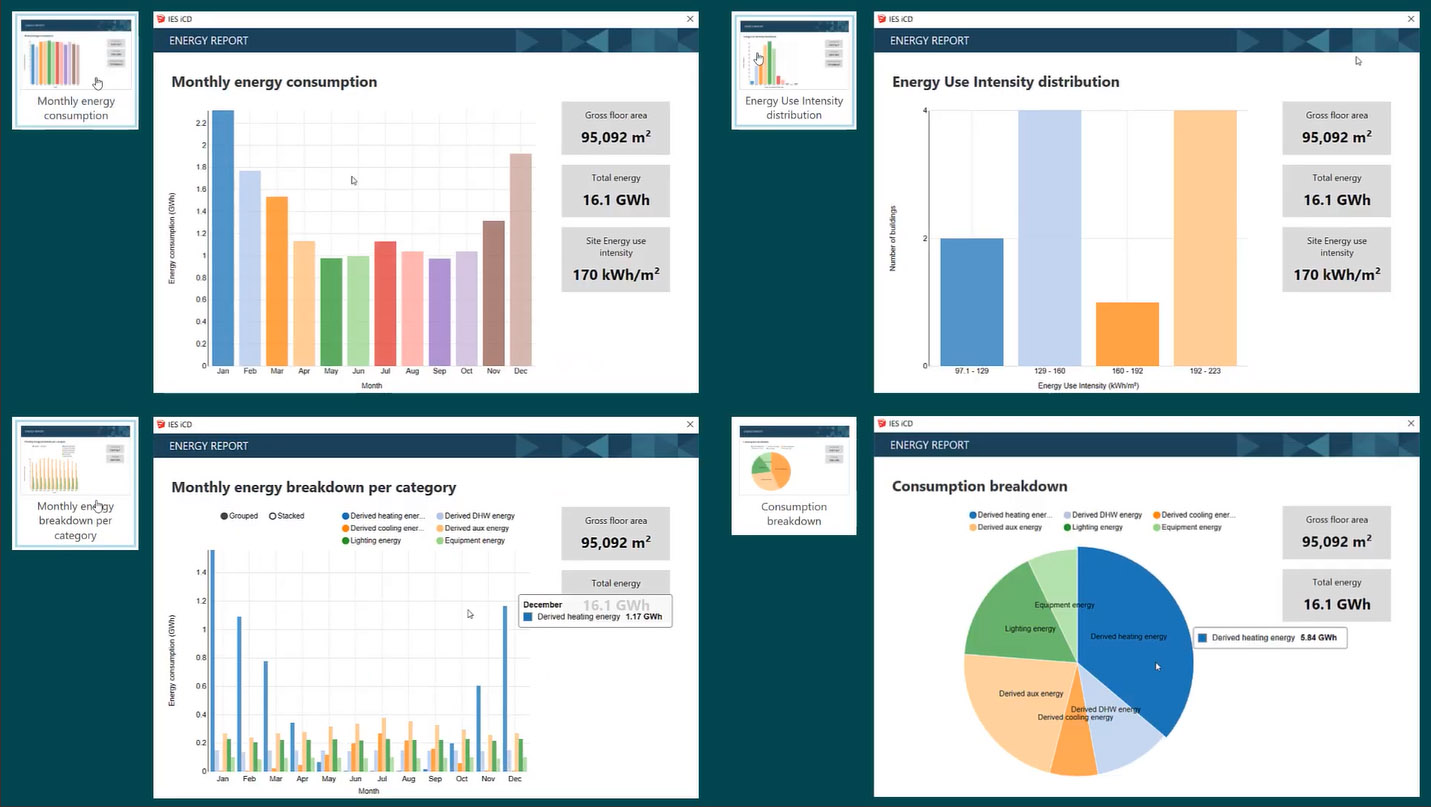
The data of each building in the model that is part of the project can be edited to change it from the default values. You would also typically specify additional details for it that would be needed for its ICL implementation and analysis, such as building type, glazing, floor area, roof type, water fixtures, etc. Using this information and the weather data for the location that has been imported from the mapping application, you can quickly run an annual energy and water simulation of the project using the built-in VE tool, as shown in Figure 3.
It should be noted that the VE tool here is working with simplified building geometry and pre-defined typical settings, which is what allows the analysis to be done so quickly. However, it is still accurate because it is being done with the tried-and-tested VE engine. IES is working on the capability to connect the iCD model of a building with its full-blown BIM model if it is available, which would make the analysis more detailed, albeit somewhat slower.
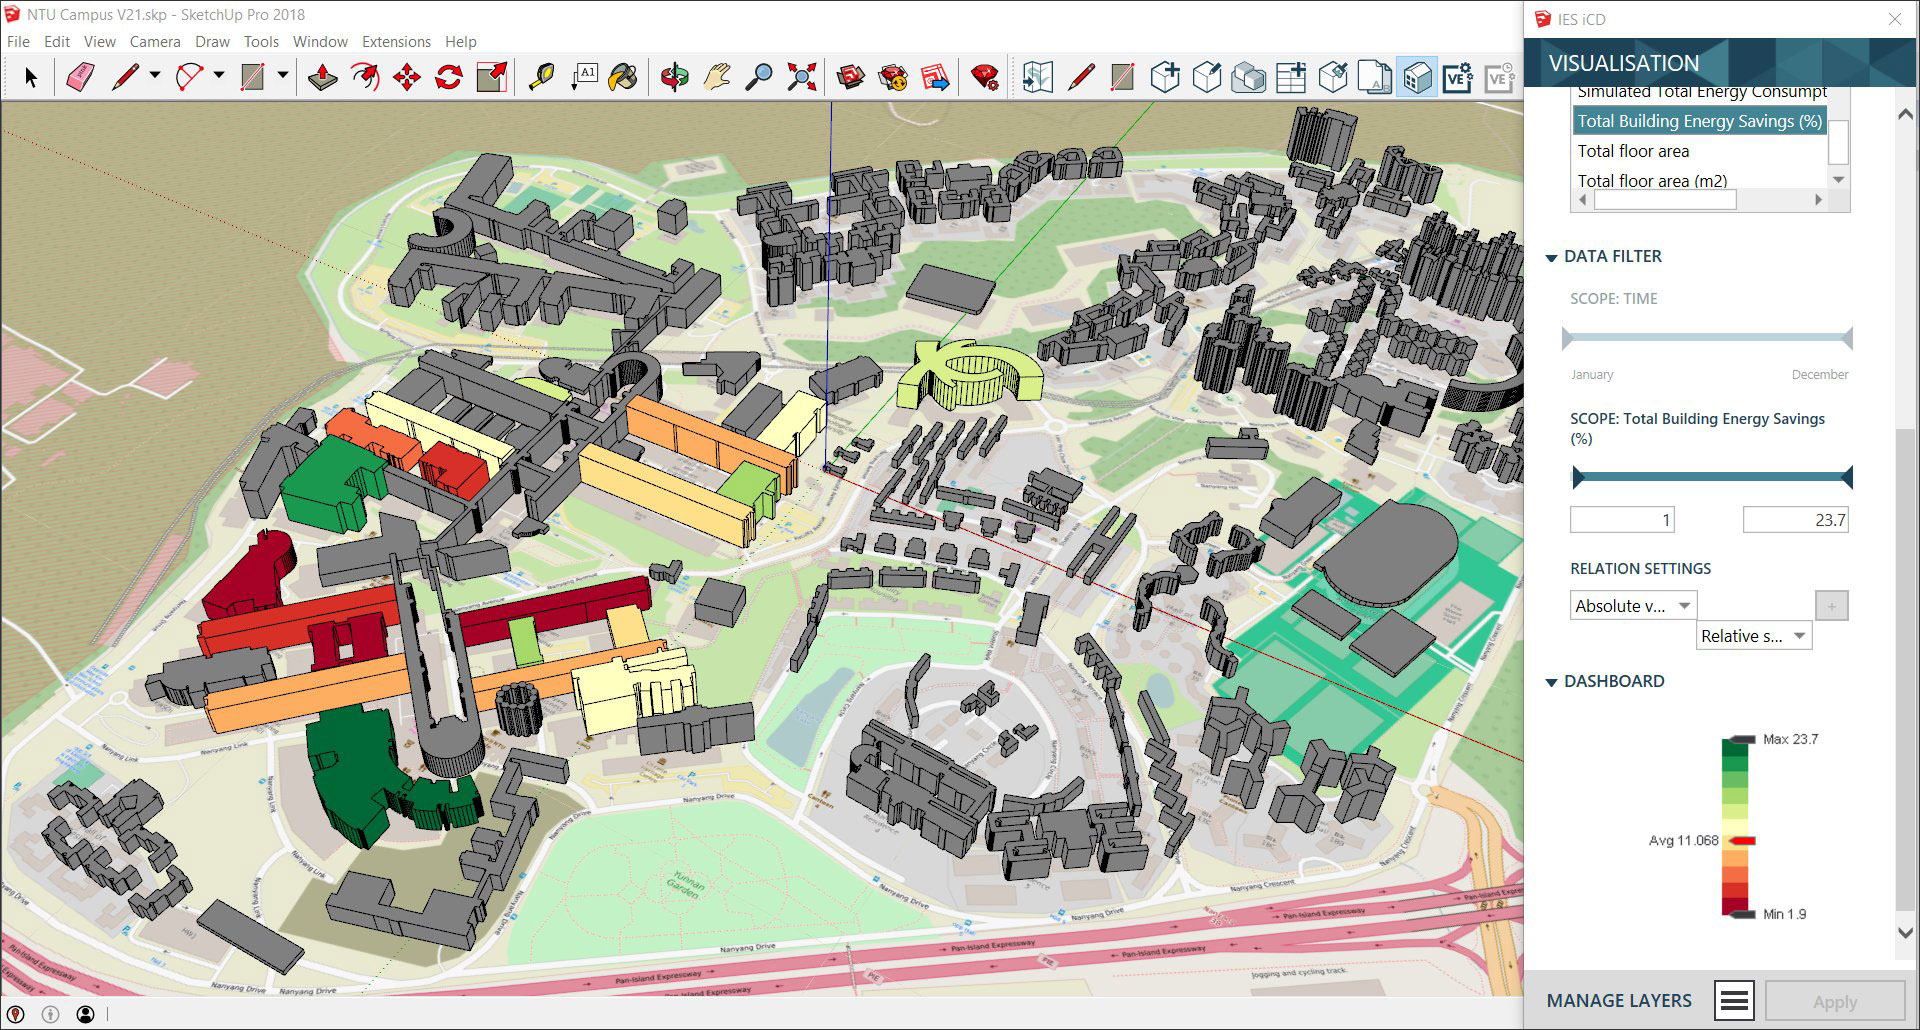
The iCD also includes a dedicated visualization tool that lets you apply various filters to visually inspect different aspects of the model (Figure 4) such as building type, energy performance, potential for renewables, solar exposure, water access, zoning, utilities, etc.

Additional features critical to the use of iCD as a masterplanning tool for sustainable community design include a tool that allows changes in the project to be tracked over time, taking into account the construction of new buildings in the region and the demolition of existing buildings; a tool for creating custom attributes that need to be evaluated for particular projects; and reporting tools that let you assess the impact of key decisions when planning new developments, retrofits, or any other changes to the project over time.
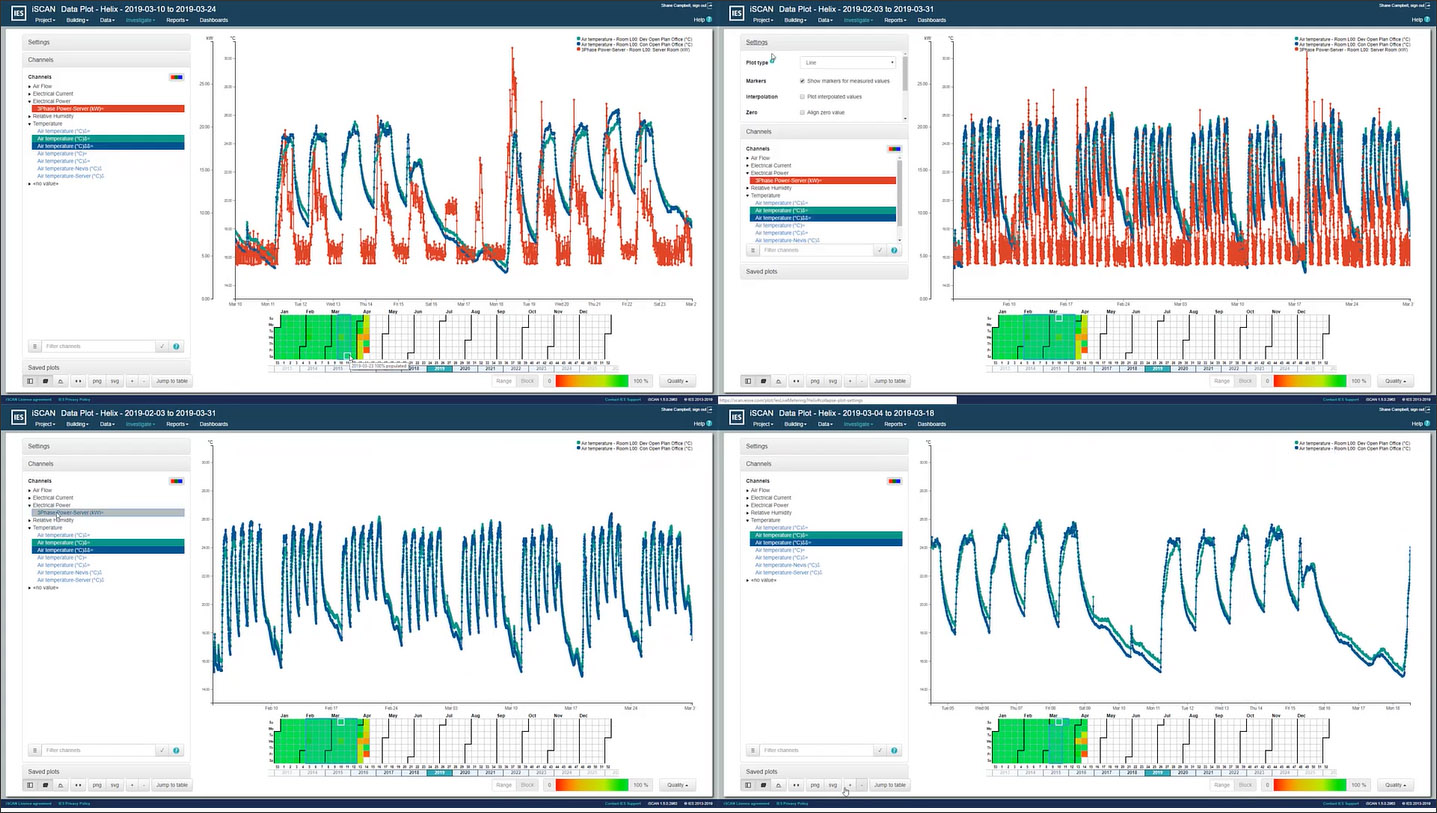
An integral aspect of improving the sustainable performance of a community is to be able to track its existing performance so it can first be analyzed and then improved. The ICL does this through its iSCAN tool, which aggregates different types of performance data for the community coming from multiple sources ranging from smart meters, utility portals, historical data files, and IoT devices to full-fledged Building and Energy Management Systems (BMS and BEMS). The connection to these sources is made directly or through APIs. Bringing together this disparate data—each with its own time series—in one consolidated platform where it can be organized and analyzed in detail is one of the most critical features of the ICL, since you can only improve something when you have an accurate assessment of its current state.
iSCAN includes tools to cross-analyze the data from different data sets, as well as smart tools to fill in any data gaps and identify outliers. This analysis can be done both at the community level as well as by drilling down into an individual building to study its performance in detail. Even if a full-fledged BMS has been implemented in a building, bringing its data into iSCAN provides faster analytics and interactive visualizations, making it easier to detect hidden inefficiencies in building performance such as a system running when it should not. It also allows alarms to be set up on live data feeds, so that an alert is triggered when something goes wrong such as an equipment malfunction. In addition to analyzing current performance, there are tools to study the impact of different interventions and control strategies to improve performance.
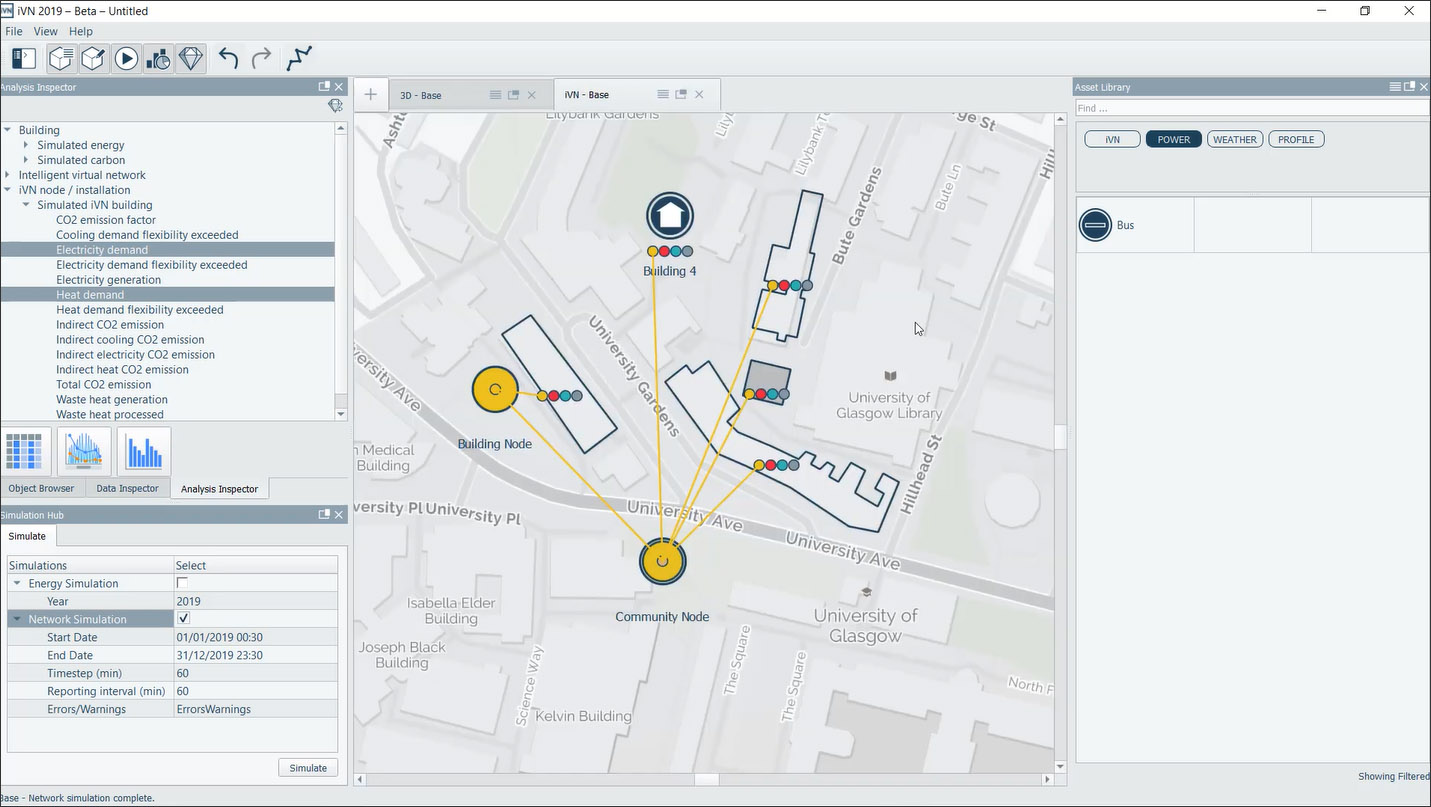
The iVN tool of the ICL is used to perform integrated design and analysis of energy and resource networks. The tool makes it possible to create a virtual design model of any energy network, with the ability to import from a library of 15 typical smart grid installations and link multiple network types—including electricity, heating, cooling and waste heat—to analyze how they dynamically integrate. Physics based models, driven by local weather data, provide the ability to track energy flow, identify waste, and maximize the value of network assets, while also enabling comparison of the current performance of the network with different future scenarios.
Often, the critical missing data piece for this type of analysis is building energy demand. The ICL suite addresses this problem by providing three ways of quickly and easily generating this data: a built-in physics-based energy simulation feature within the iVN simulation hub; the ability to import measured data from iSCAN; or energy demand data that can be generated and imported from the iCD model.
In addition to the design and upgrade of distributed energy networks or micro-grids, the iVN tool also enables assessment of different renewable energy solutions and storage strategies, and can be used to identify opportunities for energy trading, local energy bill reduction, and demand side response across the community.
IES sees ICL as a “digital twin” for sustainable design. As I discussed in my recent white paper, “Digital Twins in AEC,” the key aspect of a digital twin as opposed to a BIM model is the element of synchronicity. A digital twin is not static but stays in sync with the physical object it is “twinning” through sensors through which it is being updated continuously, thereby capturing the representation of the physical object at any time. Any testing, analysis, simulation, etc., that is needed can now be carried out on the digital twin rather than on the physical object, using accurate, “real-time” data about it rather than assumptions about its properties.
In the context of the ICL, while the digital model created using its iCD tool is static in and of itself, it can be integrated with the “live” sensor data captured by iSCAN to become a true digital twin of the project that can be used for analysis, simulation, and design. This integration essentially requires the objects in the iCD model to be mapped to the consolidated performance data streams for those objects that are in iSCAN. Setting up this mapping needs to be done manually, typically through a custom implementation. Some examples of this implementation are provided in the next section.
Once the integration has been done, the ICL model becomes a dynamic digital twin of the project that can be used to monitor and improve its energy performance. You can now have all the capabilities of iSCAN, but now seen in the context of the digital model rather than simply in the form of graphs. Additionally, the digital twin can be visualized and queried in the cloud-based iCIM interface mentioned earlier, which can serve as a monitoring and management platform for the entire community including its residents.
As we have seen, the ICL is an ecosystem of products that can be used in an integrated way. While each individual component is a standalone tool and can be used as such, using the tools in an integrated way on projects requires customized setup, training, and technical support that IES provides as a consulting service.
Some examples of ICL implementation facilitated by IES include the Trent Basin project at the University of Nottingham in the UK, where a 3D community interaction model was created to visualize real-time energy data online; Nanyang Technological University (NTU)’s EcoCampus project in Singapore, where an interactive 3D visualization and masterplanning model was created for energy modelling and performance optimization across the campus, along with the detailed simulation and calibrated modeling of 21 campus buildings; and the cities of Trondheim, Norway and Limerick, Ireland as part of the CityxChange Smart City Project, where ICL will be used to create an Integrated Planning and Decision Support Tool through the modeling and analysis of the buildings, energy grid. and any renewable infrastructure in the cities. These implementations are illustrated in Figure 7.


I was very impressed by the depth and sophistication of the ICL, yet not too surprised given that it was being developed a company with a long history, deep technical roots, and a razor-sharp focus on sustainability right from the time it was founded in 1994. Broadening the scope of its solutions from individual buildings to larger communities is a welcome development, one that is urgently needed given the demand for sustainability is getting more pressing every day. Right now, the call has been overshadowed by the more urgent need to deal with the coronavirus pandemic, but when (and if) the world gets back to normal, we will once again have to deal with the exigencies of the climate change issue.
Similar to how a BIM model enables evaluation of many more design aspects in addition to energy, I envisage that a platform like the ICL can also be used for many other aspects of neighborhood planning and design, in addition to sustainability, such as zoning, urban planning, disaster mitigation, even code compliance. It seems exactly what we want from a CIM (city information model). This is CIM, without being labeled as such.
Lachmi Khemlani is founder and editor of AECbytes. She has a Ph.D. in Architecture from UC Berkeley, specializing in intelligent building modeling, and consults and writes on AEC technology.
Have comments or feedback on this article? Visit its AECbytes blog posting to share them with other readers or see what others have to say.
AECbytes content should not be reproduced on any other website, blog, print publication, or newsletter without permission.