


On 15 August 2020, the Danish Heath Authority (Sundhedsstyrelsen) issued regulations, that among other things, required enforcement of physical distancing, both onboard trains and in public facilities. In many cases, the regulations set a target of 50% capacity. This was enacted on longer distance trains by implementing mandatory seat reservations, which were offered at no charge with a mobile phone app. However, on suburban trains and metros, there are no customer service personnel (conductors) onboard trains, and thus no one available to enforce these reservations. Copenhagen suburban trains have passenger counting technology, and so the national railway company, DSB, implemented a mobile phone app that could display the current occupation percent of individual trains in real time.
Unfortunately, the Copenhagen metro operates on a continuous, frequency-based schedule that makes tracking individual trains infeasible on this scale. Further, the lack of a timetable means that the passenger flow in the Copenhagen metro is an unplanned, stochastic process. In the fall of 2020, students Basthiann Bilde and Morten Andersen elected to study a small part of this problem, the social distancing at the stations. With the cooperation of the Copenhagen metro operator, Metroselkabet A/S, Basthiann and Morten sought to answer the question, “What is the COVID exposure risk while congregating in the station and boarding the train?”
The further, follow up question from Metroselkabet was, “Can social distancing goals be met within the limits of the built environment?” A large number of the Copenhagen metro stations are underground, and not only are the physical spaces fixed, but the ventilation systems for the spaces are also limited. To this point, Metroselkabet wished specifically to learn what adjustments could be made quickly, in the limited night working hours.
Basthiann and Morten received passenger flow data and station floorplan drawings direct from Metroselkabet, and they had at their disposal Bentley Legion software for simulation of pedestrian flow. An analysis of three characteristic stations on the network finds that there are some fundamental social distancing challenges that cannot be resolved without major infrastructure changes. However, there is hope for other mitigation solutions, and in the worst case, access to the system can be restricted as is done in Chinese metro systems.
To minimize model complexity, the analysis was limited to peak hour flows and pedestrians characterized as “commuters.” A significant question while defining the model parameters was, “How quickly do our pedestrians walk?” This may seem a minor question relevant to the social distancing measure, but it is actually central. A long-established process relationship called “Little’s Law” asserts that the inventory, the objects in a space, are directly related to the flow rate and speed of the objects. In this case, the number of passengers in the station are directly related to the volume of passengers flowing through the station and their speed. The more passengers there are in the station, the smaller the social distancing, but the faster they walk, the less they occupy specific areas, thus improving the social distancing.
A variety of sources were consulted to establish parameters for walking speed in the model. The most convincing source found was one from New Zealand, “Field observations to determine the influence of population size, location and individual factors on pedestrian walking speeds” (Finnis and Walton, 2008). This study collected 1071 observations from four separate locations during weekday daytimes. Approximately half of the observations were labeled as “commuters,” and they had both the fastest walking speed and the smallest variance. The 95% confidence interval of their average speed (meters per minute), based on a student’s t-statistic, is the range (93.305, 95.095), which focuses the input parameter quite well. It should also be noted that the average speed over the complete data set was 88.08; thus the commuters are approximately 7% faster than the general crowd.
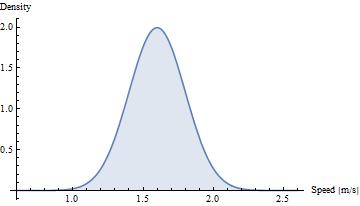
On a cautionary note, the Finnis and Walton data offers faster speeds than other studies, which might bias the results (see again Little’s Law) by returning lower passenger densities. However, this published dataset is much more detailed than other sources, which supported its selection in the end. The walking speeds are implemented in Bentley Legion as drawn from a Normal distribution with mean 1.6 and s.d. 0.2 as shown in Figure 1.
Copenhagen metro today has four lines that are essentially two separate systems of two lines each. The two systems are cosmetically similar, but were constructed nearly 20 years apart, so they have incompatible control systems and are not in fact connected. This analysis concerns the older, M1/M2, network, which has 22 stations. This system begins with a shared line at Vanløse, running through the city center, and then splitting at Christianshavn, with one leg going to the airport and the other leg running parallel roughly 2 kilometers to the west in a new mixed development region.
A three-level classification is chosen to group the stations: small (less than 7,000 passengers per day), medium (7-20,000 passengers per day), and large (over 20,000 passengers per day). With this classification, there are 11 small stations, 9 medium stations, and 2 large stations. Nine of the stations are underground, and all of the stations have a center platform between the two directional tracks.
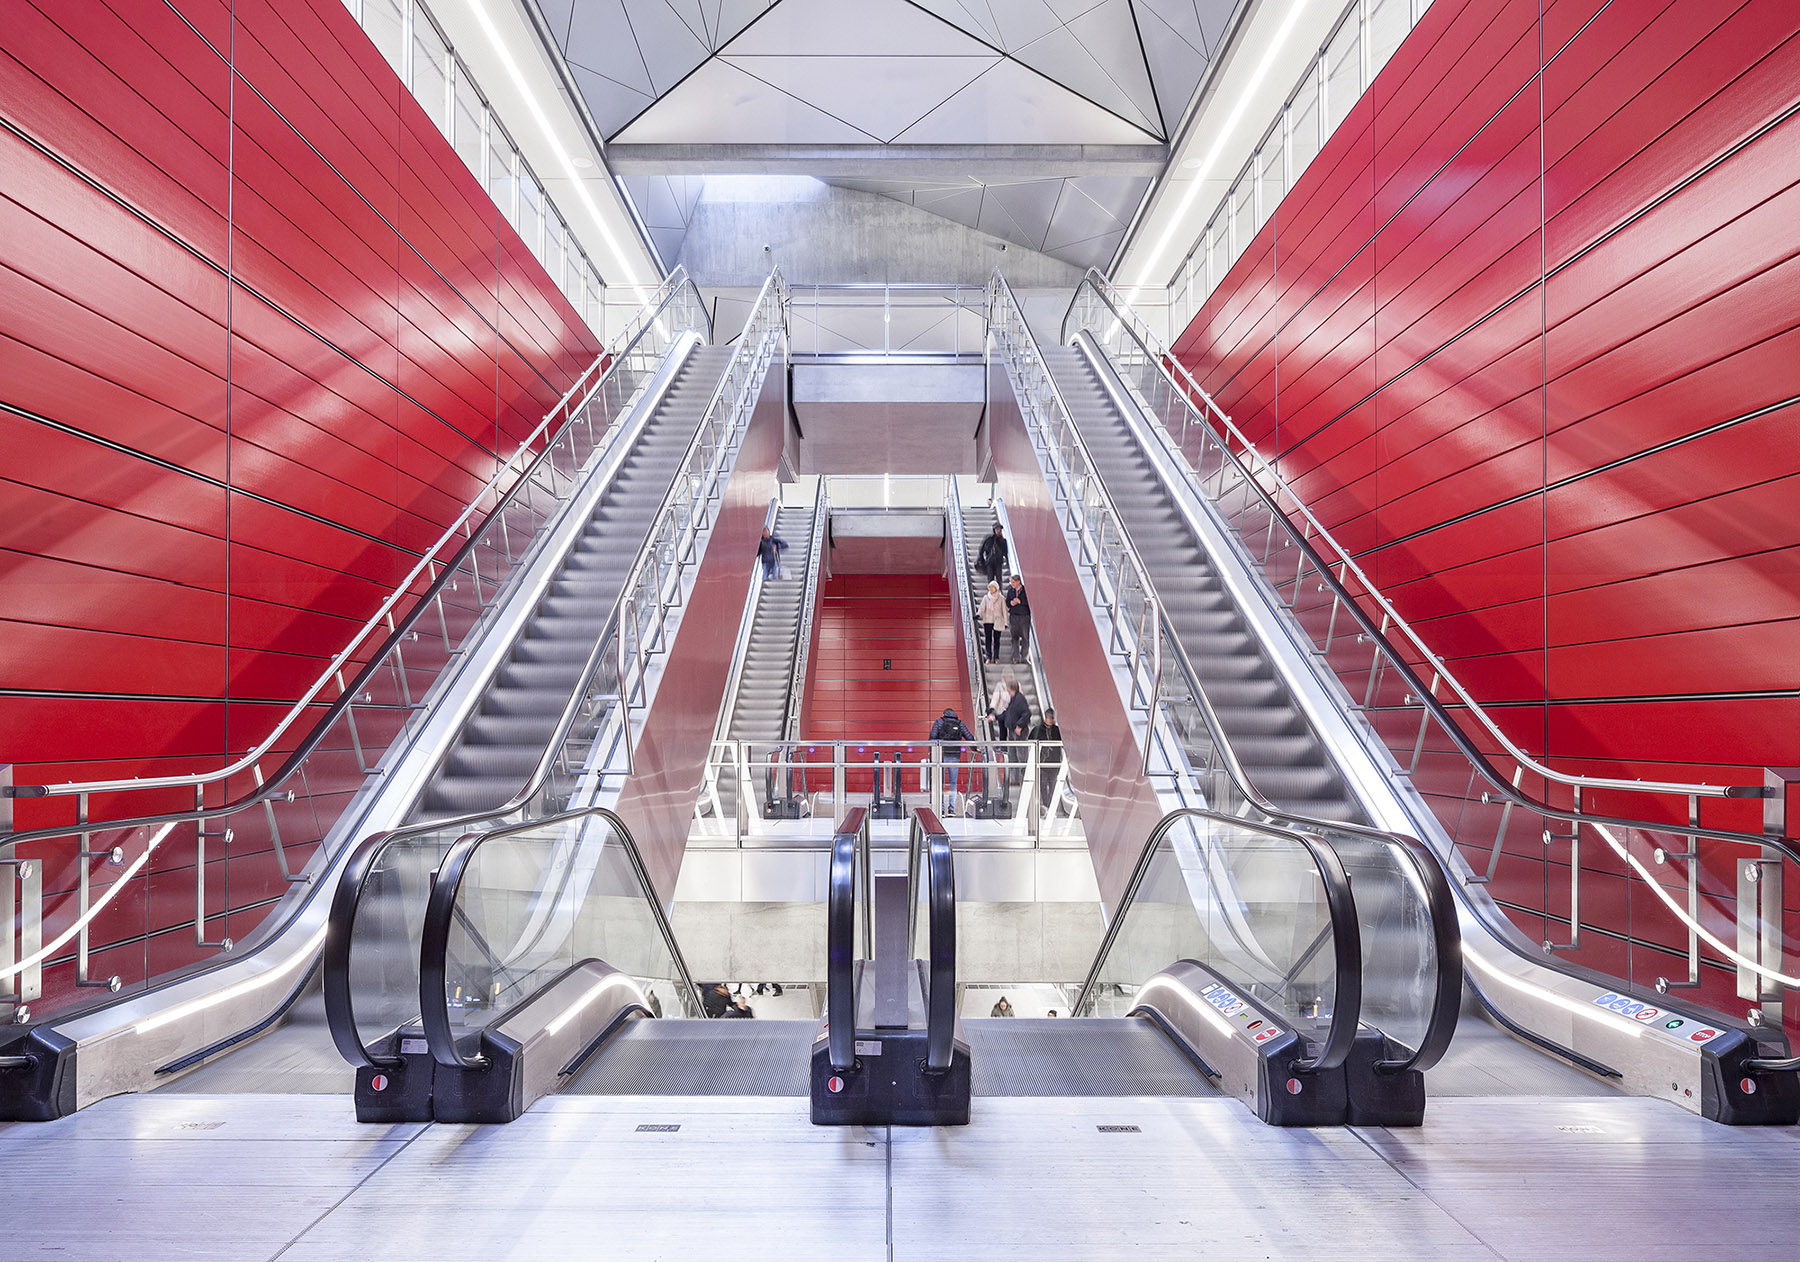
Three representative stations were selected for the analysis. The largest, Nørreport station, is the busiest transit hub in Copenhagen, second only to the central railway station. It accommodates over 50,000 passengers per day for the metro alone. Nørreport also provides the easiest transfer from metro to the primary suburban and long-distance trunk railway lines, and further has a number of terminating bus lines above ground. The station is so busy that one is prohibited from bringing bicycles into the station during peak hours.
The medium and small stations are represented by Forum and Øresund stations, respectively. Interestingly, in spite of its much smaller passenger traffic, Forum station follows a physical template very similar to Nørreport station, and nearly all other underground stations. The small category station, Øresund, serves a mostly residential area without any significant transfers to other transport lines.
As mentioned at the start, the Copenhagen metro operates without a timetable or any reservations or limits on passenger journeys, and this was a motivating factor in studying the social distancing effectiveness of these lines. The service operates at a nearly continuous departure frequency, with 34 departures per hour in each direction on each of lines M1 and M2. One of the valued selling features of the Copenhagen metro is the nearly instant service availability during most parts of the day.
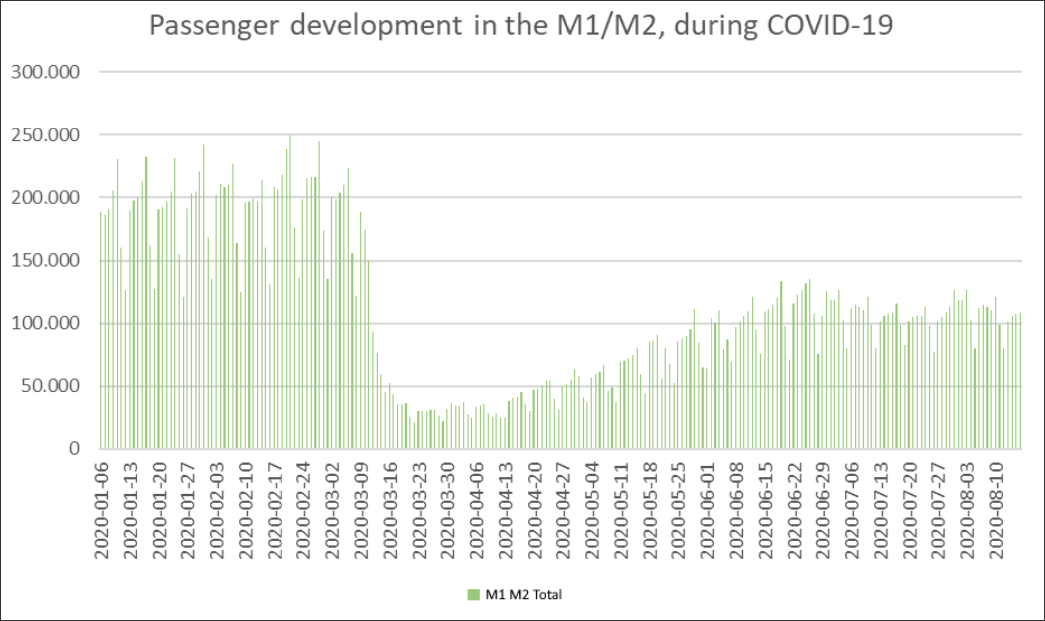
The first wave of COVID infections, and the resulting government closure of most non-essential activities, achieved on its own the social distancing sought by Danish health authorities. Figure 3 tracks the passenger traffic on the M1/M2 lines before, during, and after the first infection wave in 2020. Three traffic scenarios are studied in the social distancing model: a high, before COVID level; a medium, first recovery level; and a potential future scenario at 75% of the high level. The high level corresponds to early February 2020, and the medium level is measured from 26-28 May 2020.
The social distancing is modeled by way of measuring the density of persons in a simulated station floorplan. These floorplans were traced from PDF floorplans provided by Metroselskabet and validated against known sample dimensions of the stations. The simulation model samples a random arrival pattern (quantity) of passengers arriving to the station, and then additionally randomly samples their walking speed. The model then simulates the path of each passenger from station entrance to train and vice versa. Data is collected on their dynamic position, and post processing produces heat maps of the person density in the station.
Bentley Legion implements an agent-based simulation model. In this case, the “agents” are the passengers, which are also known as entities in event-based discrete simulation models. An agent-based model is one where the agents make independent decisions according to their individual maximum welfare. This can be a quite intensive calculation according to how frequently the model is calibrated to revise its agent decisions, as each revision of an agent’s decisions then potentially triggers a re-evaluation of many other agents’ decisions, potentially leading to an exponential revision of all calculations.
In Bentley Legion, each passenger (agent) is presumed to make rational decisions and correctly calculate their welfare and costs. Paths from origin to destination are calculated to a minimum cost objective. That objective includes time and various measures of comfort and convenience.
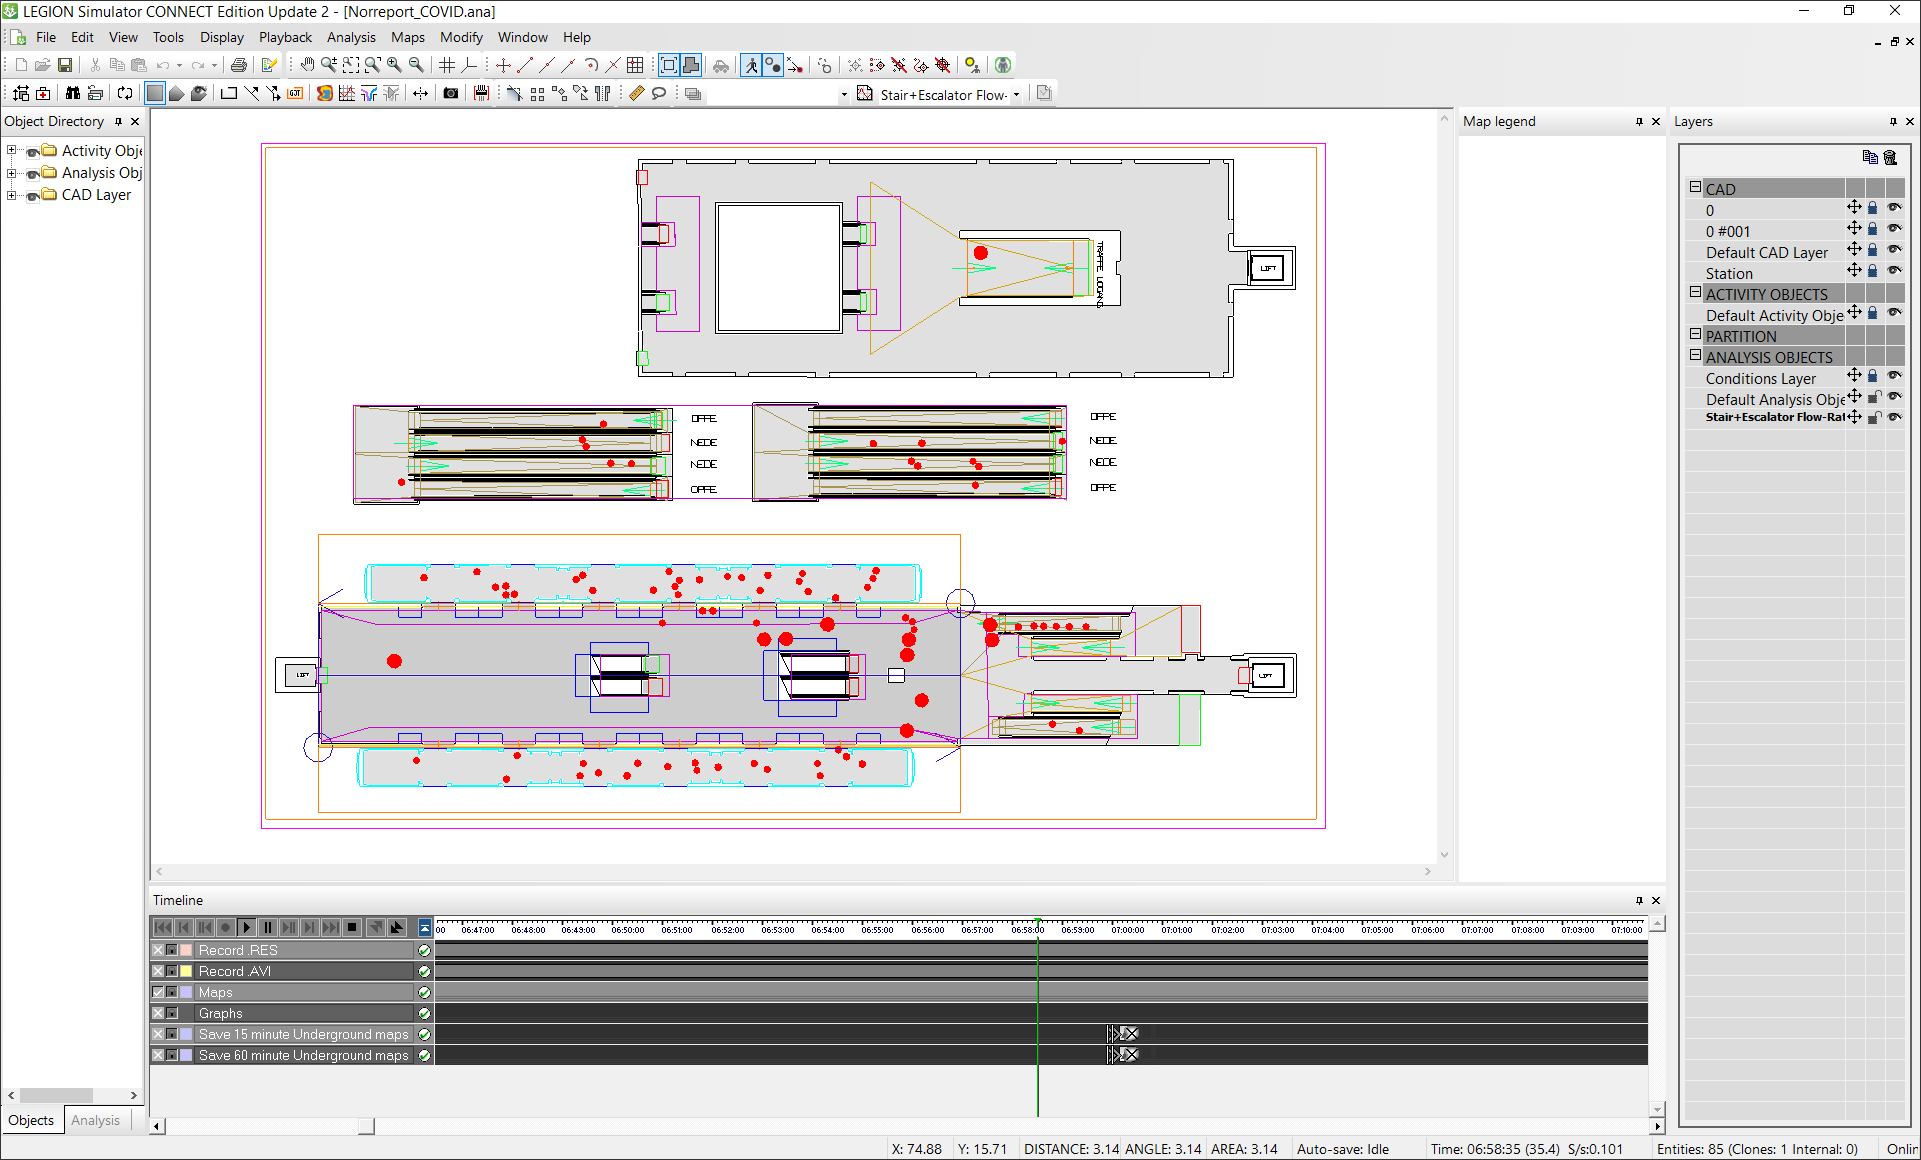
Figure 4 presents the user interface for one of the station models. The simulation runs were dimensioned at 2.5 simulation clock hours, equivalent to a full cycle of peak travel. Each run collects data on approximately 87 cycles of passenger arrival and train departure. Frequent use is made in the model of “direction modifiers,” so that passengers react differently to especially restricted spaces, escalators, etc. One limitation of Bentley Legion in this analysis is that it does not distinguish between social distancing face to face and face to back. Face to back, or one-way flow, is generally believed to be less infectious.
During the first wave of infection in 2020, the Danish Health Authority recommended a minimum separation of 1 meter between persons in public spaces, preferring 2 meters where possible and when there is known infection. The simulation model was then calibrated to present results with respect to a 2 meter benchmark of separation. As the trains themselves are only 2.65 meters wide, no attempt was made to model or measure social distancing within the trains themselves. There is no expectation of achieving social distancing while onboard the train itself.
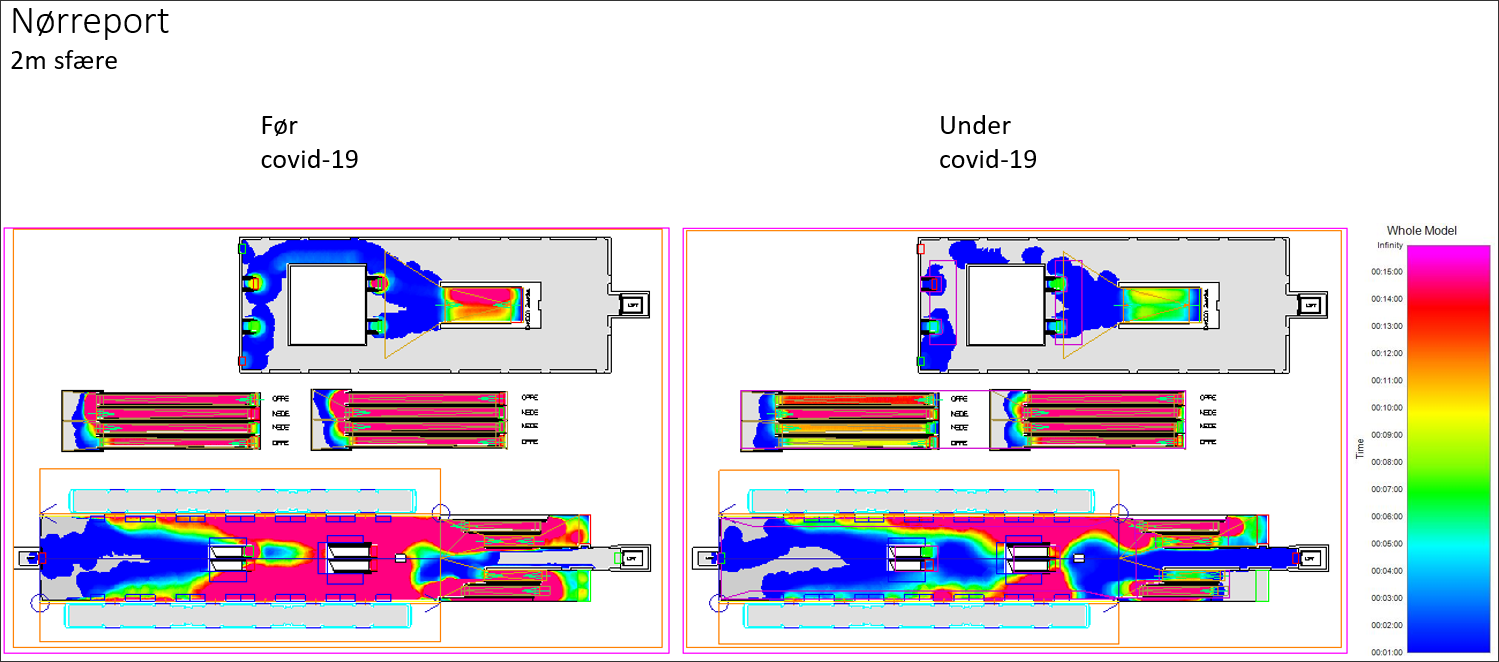
The model records five measures of social distance adherence: average density (passengers/m2), maximum density (passengers/m2), area utilization (time used), and 1- and 2-meter sphere violations (cumulative time that agents’ personal space are violated by other agents). Figure 5 presents an example result for violations of the 2 meter sphere. The scale is in minutes accumulated over the model run. For example, the blue zone represents a maximum of five minutes of violated contact accumulated through the 2.5 hour run.
After a thorough analysis, the greatest number of violations were found, not surprisingly, at Nørreport station. The other stations generally had a very low level of violations. A particular problem with Nørreport is that the pedestrian flow to and from the suburban railways must pass lengthwise along the platform to one end, and then up a narrow escalator, and through a restricted passageway. Unfortunately, these are hard physical limits that cannot be adjusted by small improvements.
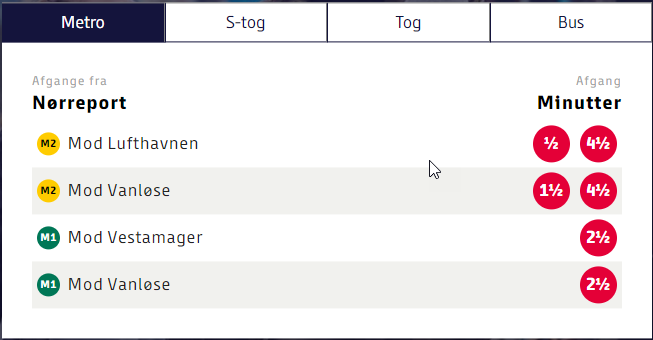
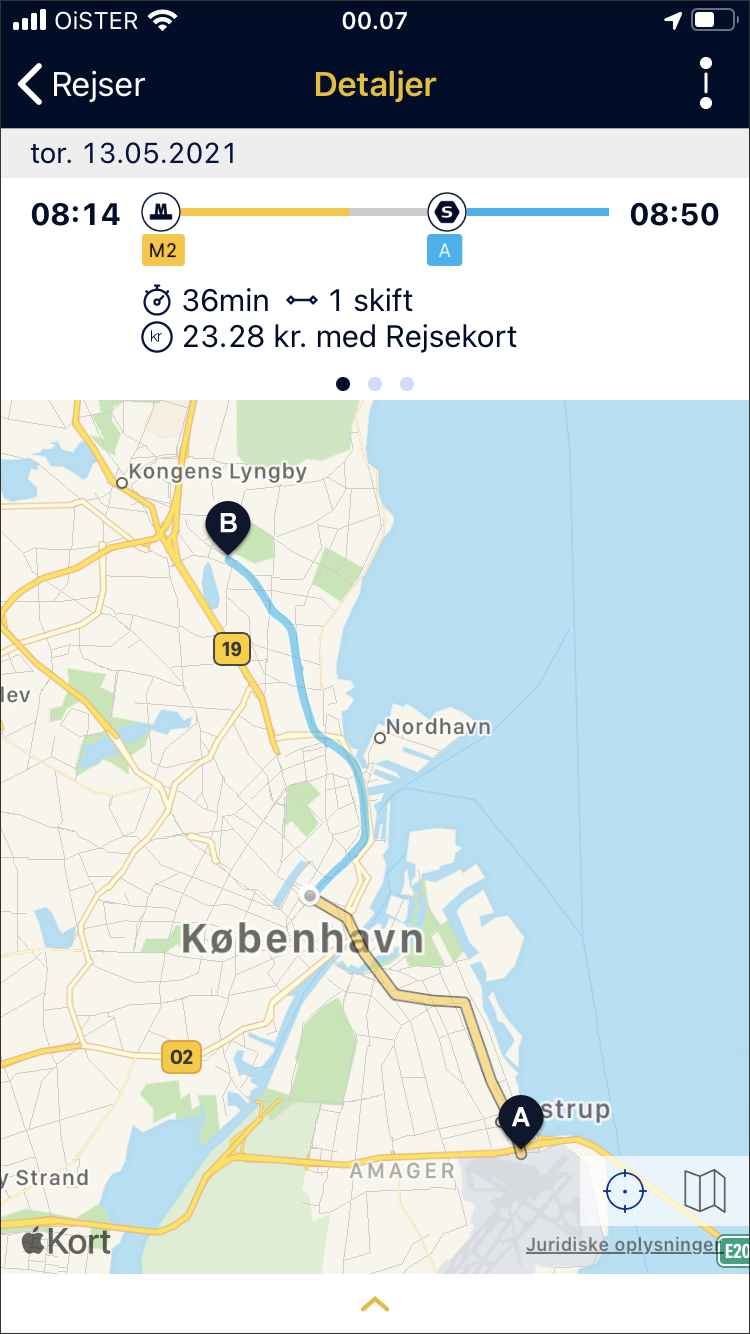
It is a warning to future transport plans to consider the potential traffic flow when planning and dimensioning station areas. One potential subject for future research is to actually redirect passengers by instructing them to take different transport routes, away from Nørreport station. This is potentially viable because the majority of transit users in Copenhagen rely on a public mobile phone trip planning app, Rejseplanen, shown in Figure 6.
Acknowledgements: The authors wish to thank Metroselskabet I/S for their support and cooperation in performing this research.
Dr. Steven Harrod is an Associate Professor at the Technical University of Denmark. Dr. Harrod is a specialist in transportation management, transportation analysis, and supply chain networks. He has published numerous research papers in journals such as Transportation Science, Transportation Research Part E, International Journal of Production Economics, and Simulation. Dr. Harrod obtained his PhD from the University of Cincinnati, and an MSc from MIT. He is a member of the Analytics Certification Board of INFORMS (2020 - 2022).
 Basthiann August Bilde is a consultant for Atkins Denmark, working with transport planning. As a consultant, Basthiann has experience working on multiple public transport planning projects, including some bigger transport modelling projects for the Copenhagen Metro Company. Basthiann has recently finished his bachelor’s degree in Transport Planning and Engineering, from the Technical University of Denmark, with the topic: “COVID-19’s influence on the passenger flow in the Copenhagen Metro, M1/M2”
 Morten Lund Andersen is an independent consultant focusing on data and transportation modeling. As a consultant, Morten has experience working with the road infrastructure, including some pedestrian safety modeling for Danish municipalities. Morten has recently finished his bachelor’s degree in Transport Planning and Engineering, from the Technical University of Denmark, with the topic: “COVID-19’s influence on the passenger flow in the Copenhagen Metro, M1/M2”
Have comments or feedback on this article? Visit its AECbytes blog posting to share them with other readers or see what others have to say.
AECbytes content should not be reproduced on any other website, blog, print publication, or newsletter without permission.
The ultimate goal in AEC is to design good buildings that work well. This research report looks at how habitability analysis can to used to design and operate buildings with a better understanding of how they will be used by the people for whom they are intended.
Given that human behavior is far from predictable, how does pedestrian simulation actually work? This article looks at several applications in the field and delves deeper into LEGION, which Bentley just acquired.
This article highlights the impact of the coronavirus crisis on the AEC industry and the response to it from AEC technology. A pandemic like this also behooves us to look into the future and ask how this might change what gets built, how, and the technology that will be required to support it.
Now that the AEC industry has had several months to settle in a COVID-19 reality, Stephen B. Jacobs, the founder of the SBJ Group, discusses where we currently stand and what proactive measures designers can implement as we build and adapt in a new abnormal.