Nine years ago, I wrote an article for AECbytes (Viewpoint #4, April 14, 2004) on the topic of labor productivity. I also wrote earlier articles on this topic in the 12/13/1999 issue of ENR magazine and in an academic journal in 2001 (“Discussion on U.S. Construction Labor Productivity Trends, 1970-1998” in J. Constr. Engineering and Management, ASCE. 127[5]: 427-429.). During the intervening years, there have been many changes in the AEC industry that have had the potential to impact labor productivity, and this is a good time to take another look to see what, if any, changes can be detected from the national statistics about the industry. The major changes include the increasing use of BIM technologies and the lean collaborative processes it supports, and the recent very significant boom and bust in the industry.
The definition of labor productivity at the task level is quite simple: output per work hour, e.g.,50 SF per work hour of wall forms built to a given specification at grade level. However, when measuring the output of entire industry rather than a task, output is defined in dollars of revenue (for a given base year) per work hour. There are two US Government agencies that measure the outputs and inputs of almost all industries. The Census Bureau (CB) focuses primarily on outputs (such as the C30 series of construction industry output) and the dollar value of inputs, while the Bureau of Labor Standards (BLS) focuses on labor inputs and many other measures of labor. The data sets produced by these groups are updated weekly, monthly, annually, and for the Census Bureau, every 5 years in their Economic Census. BLS does calculate labor productivity for some industries, e.g., manufacturing and all non-farm industries, but does not do so for the construction industry. It requires careful use of the available data to make valid comparisons over time and within different sectors of the construction industry. A third government agency, the Bureau of Economic Analysis (BEA) takes the data collected by other agencies (CB, BLS, and others) to develop GDP, Value Added, Input/Output analyses and other measures of US economic activity. Using the data from these three sources provides many insights into the construction industry.
There are 3 major problems that need to be addressed:
An important issue is that not all data series have been measured in the same way over the time period from 1964 to the present. There were significant changes in methodology in 1982 and 2003 that make it difficult to bridge these years for some of the data. In 1997, the Census Bureau adopted the North American Industry Classification System (NAICS) for classifying business establishments to replace the Standard Industrial Classification (SIC) system. These definitions (further modified in 2002, 2007 and 2012) are used for all input data, e.g., dollars of output by type of structure, also differ from the breakdowns used by the BLS (dollars and hours by type of labor function, say painting, which can be used on various types of structures). This makes it difficult to calculate labor productivity for various types of structures, but it can be done for major groups such as all buildings. For each of the graphs that follow, I will indicate what data was used so that interested readers can look further into the sources and develop their own analyses. For those who would like to read more deeply on this topic, I highly recommend this paper (Huang, A. L., Chapman, R.E., Butry, D.T. “Metrics and Tools for Measuring Construction Productivity: Technical and Empirical Consideration” published by National Institute of Standards, Building and Fire Research Laboratory, Sept., 2009, available at http://www.nist.gov/manuscript-publication-search.cfm?pub_id=903603) where there is a detailed explanation of the problems of productivity measurement in the US construction industry (particularly for subdivisions within the industry), and a review of all relevant research papers.
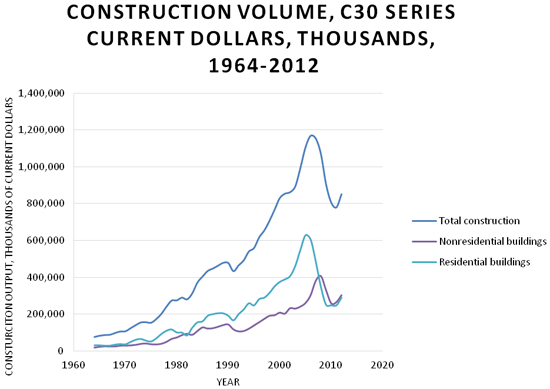
Figure 1 shows total construction industry output from 1964 to 2012 in current dollars, together with some of its major components. Private construction is by far the largest component of the total (about 75%), and residential construction represents more than 50% of the total but dropped off to just 33% of the total during the 2007-9 decline. We can observe the tremendous buildup in construction volume from 1991 through 2006 and then the subsequent bust through 2009 with a gradual recovery after that. This led to significant fluctuations in demand for labor and other resources which had impacts on both the prices and availability of resources. During this time period, construction output represented from 8% to 10% of total GDP until it dropped to 6.5% in 2011.
In order to calculate labor productivity over a time period, it is necessary to convert current dollars to constant (real) dollars for a given base year. There is no single deflator that is available for the total construction industry. However, there are a number of deflators that are available from the BLS, Census Bureau, and the BEA for various time periods. These are shown in Table 1.
Table 1. List of price deflators applicable to the construction industry.
Price Index |
Range of Years |
Annual construction labor cost index |
1964-2012 |
Annual consumer price index |
1964-2012 |
Annual construction value in place index |
1964-2002 |
Annual building value in place index |
1964-2002 |
House price index |
1964-2012 |
Price deflator (Fisher) index of new one-family houses under construction |
1964-2012 |
Producer price index for inputs to construction industries |
1987-2012 |
Producer price index for non-residential maintenance and repair |
1987-2012 |
Producer price index for maintenance and repair |
1987-2012 |
Producer price index for residential maintenance and repair |
1987-2012 |
Producer price index for new construction |
1987-2012 |
Producer price index for residential construction |
1987-2012 |
BEA Chain-type price indexes for value added |
1947-2011 |
BEA Chain-type price indexes for gross output |
1987-2011 |
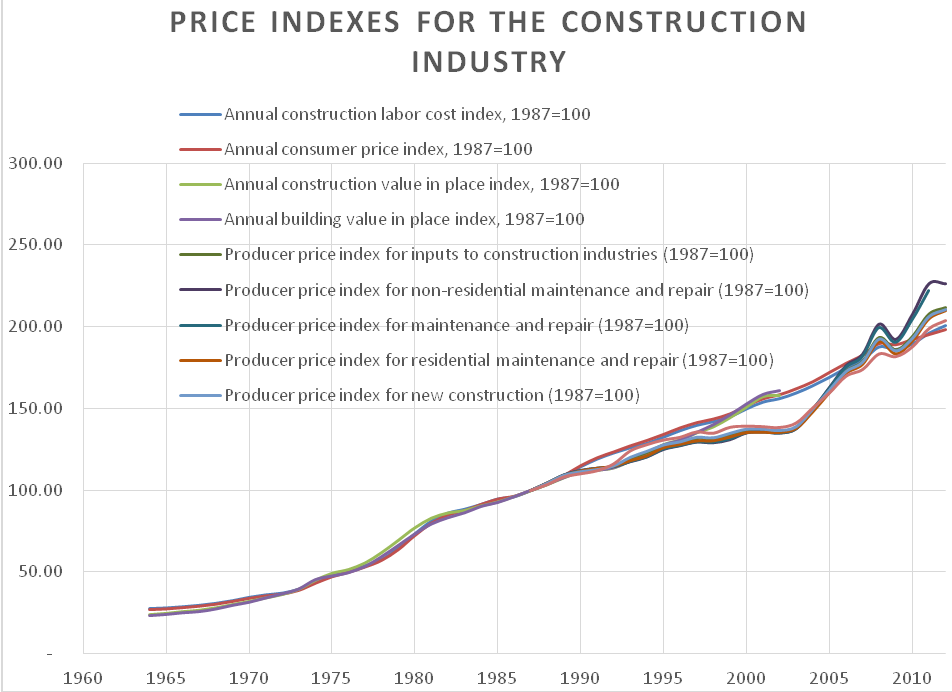
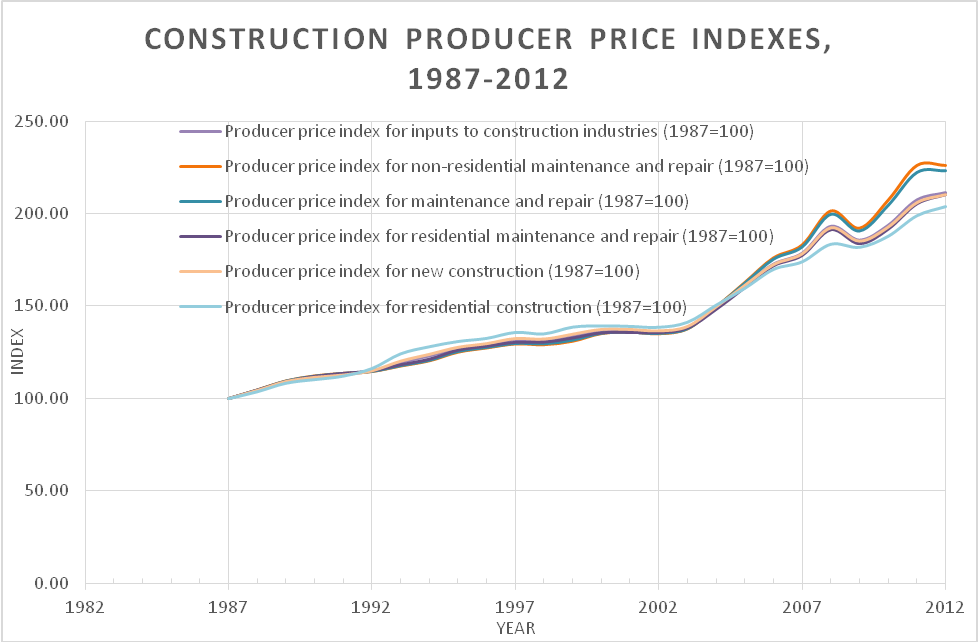
Figures 2 and 3 show that all of the price indexes are almost identical until around 1990 with some significant dispersion starting around 2000. Figure 3 gives a more detailed picture of this period. This dispersion reflects the fact that during the rapid expansion of the construction industry that started in 1990, the prices for various resources began to reflect different supply and demand pressures. For example, as housing output expanded rapidly, the price of homes rose faster than other segments of the industry. Hence the price indexes tied to home prices rose faster than others. It would be inappropriate to apply a price index for homes to all industry output. Thus, in selecting deflators to use for calculating constant dollar output for the total industry, only those indexes that apply to the total industry will be used.
Using the selected deflators from Table 1, we can now deflate the current dollars of output shown in Figure 1 to constant dollars for the base year of 1987. This is shown in Figure 4.
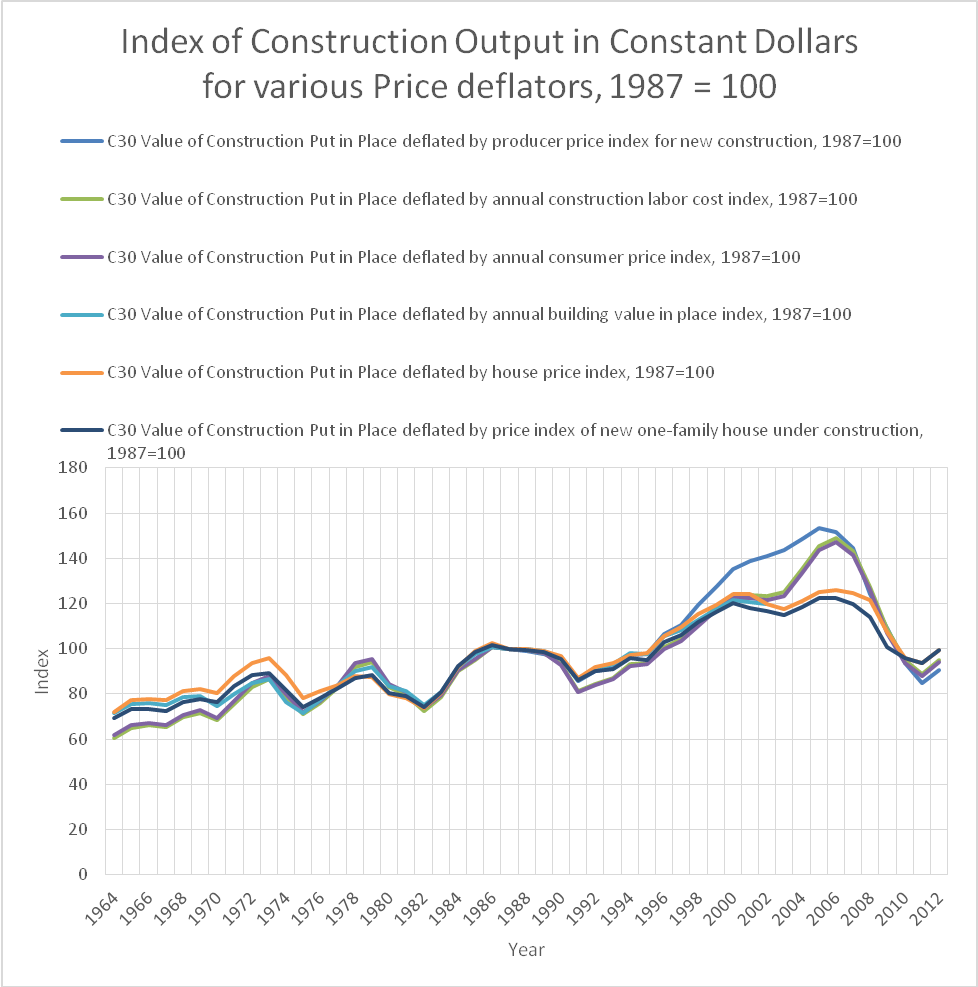
This figure clearly illustrates the very significant increase in construction volume starting in 1992 and the subsequent rapid decline starting in 2006-7 back to the 1992 level. It also shows that the difficulty of evaluating the price index for all construction during the boom years. Finally, it illustrates that for the majority of the construction price indexes, there is very little difference in calculated real output over the period prior to 1992.
The annual work hours collected by the BLS are derived from weekly input collected from a large sample of companies from all segments of the industry. These hours, when multiplied by the number of workers for each week, become the basis for annual work hours. Figure 5 shows the index of work hours over the time period of 1964-2012.
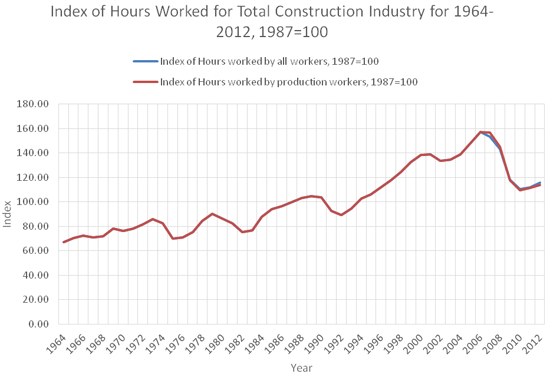
The chart clearly shows the fluctuations of labor resulting from the boom and bust cycles that characterize the construction industry. During the peak years of 2006-7, there were 15.5 billion hours worked by 7.7 million workers. This dropped to 11.4 billion hours in 2012, a decrease of 26% or roughly 1 out of every 4 workers (about 2 million workers).
We are now able to compute labor productivity based on calculated constant dollars divided by work hours for the total construction industry over the 1964 to 2012 time periods. In addition, we can compare this to labor productivity for the nonfarm sector as calculated by BLS and available at their website. These results are shown in Figure 6.
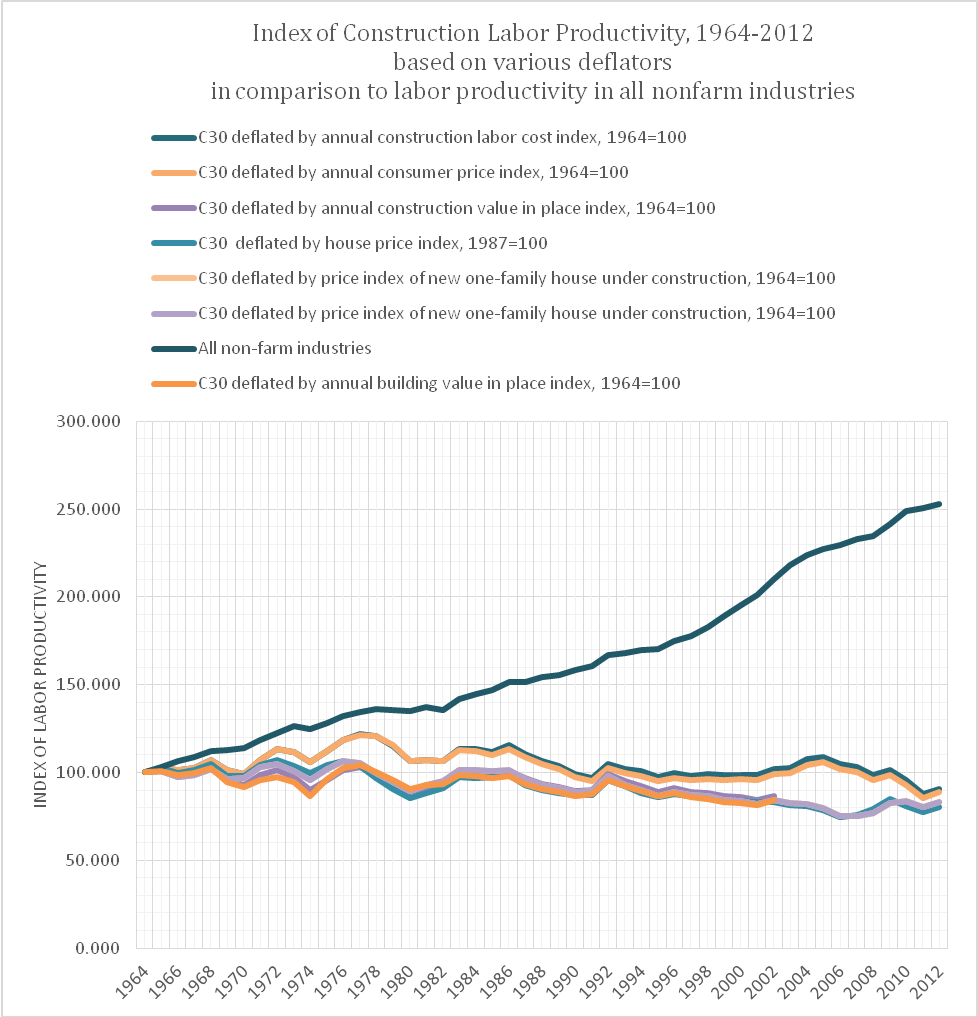
We see that labor productivity for the total construction industry slightly declines over this time period (with some minor exceptions), and that there is some variation depending on which deflator is used. However, the general rate of decline is about the same: a linear trend line shows a -0.32% per year decline, while the trend for all nonfarm industries is positive 3.06% per year. The net impact over the 48 year time period is very significant.
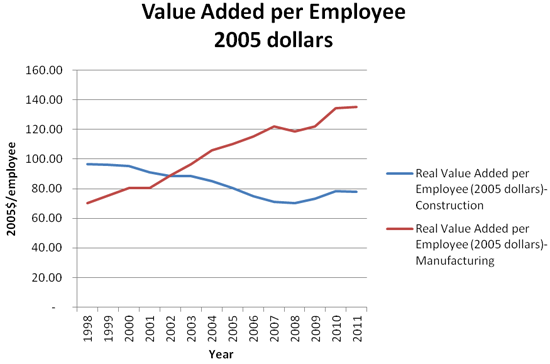
Another way to measure labor productivity is to use real value added (VA) per employee. Value added reflects the net value added within the industry and does not double count outputs that become internal inputs within the industry, e.g., subcontract charges to general contractors are only counted once. If the VA per employee declines over time, it reflects less output per employee which is lower productivity. The BEA calculates real VA for all US industries (see Figure 7) which permits comparisons between industry sectors.
Thus, we are left with the rather depressing result showing that there are a number of structural problems within the industry that stand in the way of improved labor productivity at the total industry level and that these show no indication of improving over this time period. Similar trends were observed in earlier papers. We will now turn our attention to these structural problems.
The description of potential causes for poor labor productivity that have not improved over many years is well known to practitioners. It is difficult, perhaps impossible, to know the relative importance of each factor which will vary from project to project and the types of work involved. Some factors have more significance for buildings and perhaps less impact on heavy civil work (roads, dams, power plants, etc.,) which tends to be done by larger firms using more capital intensive methods. There is some data to support this, but this will not be pursued in this paper which is concerned with the industry as a whole and not its sub components.
Construction projects are all different in many ways for often unavoidable reasons. These variations include owners, financial relationships, design, team members, workers, site locations, ground conditions, weather, regulatory codes, etc. These are all reasons why it is so difficult to optimize knowledge, take advantage of past “lessons learned” and utilize capital intensive methods which might not work on future projects. There is a need for flexible approaches that minimize risk instead of the most efficient solution for a particular case. This leads to more labor intensive solutions unless there is a significant opportunity to benefit on a large project from a specialized efficient solution. It also leads to resistance to change because the benefits of change may not be realized on the current project and thus require multiple projects to achieve a payback.
In many project teams, there is a lack of integration of design and construction, and often poor collaboration among team members. This leads to risk-averse behavior as team members try to protect themselves from the impacts of changes caused by errors, omissions and owner modifications. These issues are frequently present on design-bid-build and even design-build projects where some team members submit bids (typically sub-contractors), the low bidders receive awards and then try to benefit from extra work. The results are projects that are over budget, behind schedule, and more claims. It is not surprising that labor productivity suffers under these conditions.
The use of paper documents produced by architects and designers working independently and not able to find many problems until the construction phase leads to difficulties in coordinating and managing the work effort. There are significant additional costs from capturing and resolving the data from multiple independent sets of plans which are inherent in this process and result in errors, omissions, extra work, and claims. The additional costs of poor data interoperability were documented in a NIST study titled “Cost Analysis of Inadequate Interoperability in the U.S. Capital Facilities Industry” (see http://www.nist.gov/manuscript-publication-search.cfm?pub_id=101287), published in 2004.
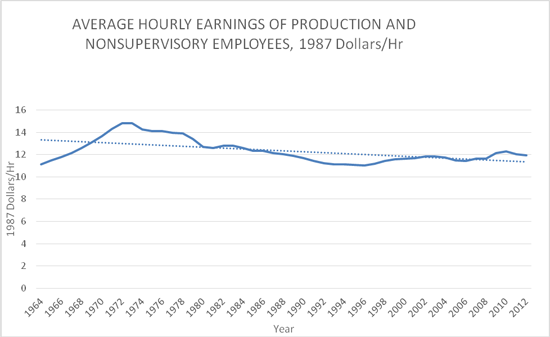
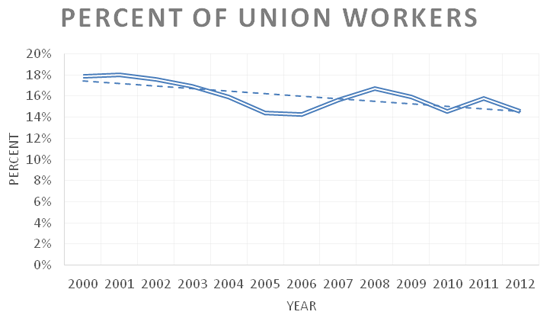
We have seen from the graphs of construction output and work hour input that the construction industry is characterized by periodic boom and bust cycles. This tends to reduce investment in capital equipment and use of off-site prefabrication which might not be utilized during a subsequent period of low demand. This reinforces labor-intensive methods, which in turn, puts an emphasis on reducing costs by reducing training of the labor force and use of the cheapest labor available. Figure 8 shows that hourly earnings (which includes base wages and all employee benefits) for construction workers, on a 1987 constant dollar basis, exhibits a declining trend. To calculate this series, the current dollar values were deflated by the Construction Labor Cost Index values for the same year. Figure 9 shows that the labor unions play a relatively small role in the industry and appear to be slowly declining over the past 12 years. Of course, in certain areas, they have a very significant participation.
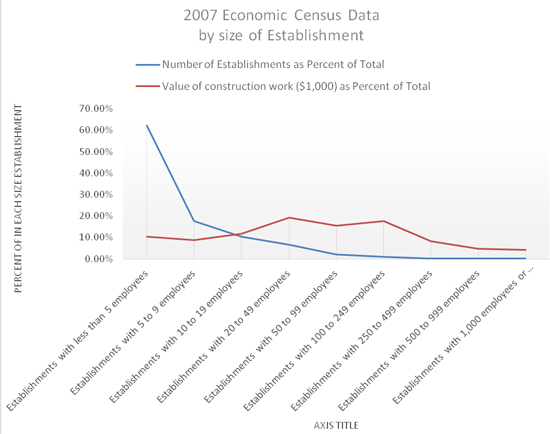
The construction industry is characterized by a large number of small firms and relatively few large ones. Figure 10 shows that in 2007 (2012 Economic Census data is not yet available), roughly 62 percent of firms have 5 or fewer employees and generate about 10% of dollar volume. Including the next three size groups (up to 49 employees) accounts for 96.7% of the firms and 51% of the volume. Thus, only 3.3% of the firms account for the remaining 49% of volume. The smaller (many single employee) firms have difficulty adjusting to more capital intensive methods because they cannot make the necessary investment. While there it is relatively easy for a small firm to enter the industry, during declines it is also easy to exit. Thus, there is considerable turnover at the bottom end of the industry which makes it harder to implement new methods. This is particularly true for the building segment that is characterized by many smaller trade crafts.
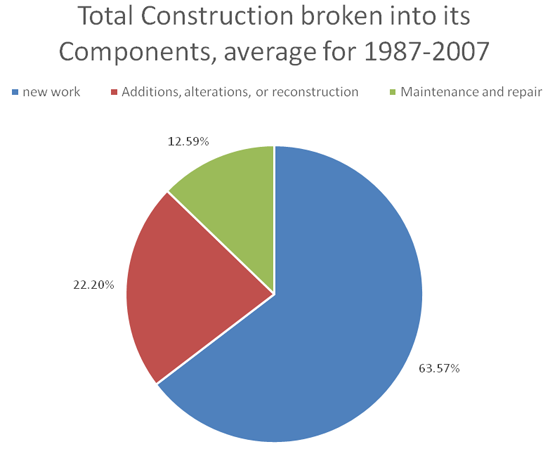
Finally, a significant amount of the work in the construction industry is remodeling and upgrading work as opposed to new construction. This work has lower labor productivity than new work because it must be done under more difficult conditions where access and space are limited and safety of the public can be a major concern. In addition, it is necessary to adapt to existing conditions (which are often not as predicted on plans) and problems. Over the 1987 to 2007 time period, the pie chart in Figure 11 shows the relative percentage of each type of work. The percentage of maintenance and repair grew slightly over this time period. It might surprise some readers to see that New Work represents only 65% of total volume, yet this is the segment that receives most attention in research and trade press. The high proportion of remodeling and upgrading sets the construction industry apart from others, where only new items are produced.
The preceding discussion certainly provides many reasons why the construction industry has difficulty improving its labor productivity. Indeed, it is clear that unless significant changes in design and construction practice are introduced, there is little reason to believe that the situation will change. The following discussion describes these potential sources of improvement.
By better use of BIM, I mean its use as a source of design and construction information from the earliest stages of a project. BIM has been in use now for over 10 years and still is often used to produce coordinated drawings which then are used in traditional design-bid-build contracts. This reduces the ability to closely coordinate the project team and produce a superior design and construction effort. Clearly, a team that can design and build in a virtual environment before getting to the site will be better prepared for an efficient construction process that can take advantage of engineering and construction analysis. This approach minimizes the need to resolve questions in the design after construction has started which cause delays and additional costs. Furthermore, the design can reflect constructability analysis so that it will be easy to build and take advantage of prefabrication when practical. Materials can be ordered when needed and installed off the truck rather than requiring additional stockpiling at the site. These and many other uses of BIM related processes are described in the BIM Handbook (“BIM Handbook, A Guide to Building Information Modeling for Owners, Managers, Architects, Engineers, Contractors and Fabricators”, second edition, by Eastman, C. M., P. Teicholz, R. Sacks, and K. Liston, John Wiley and Sons, Hoboken, NJ., 2011) and other BIM references.
It is too early to measure the impact of BIM on labor productivity. But over the coming decade, as it becomes more widely used and better understood, the impacts should be seen. At the very least, owners can anticipate a more predictable time and cost for their projects.
The use of BIM supports greater use of off-site prefabrication and use of manufactured components (engineered for the site) to be integrated into the design and construction process. The use of these components simplifies the job site and reduces the need for labor at the site where it is much less effective (lower value added) than at a manufacturing site where specialized equipment can be used. A study by Chuck Eastman and Rafael Sacks in 2008 (“Relative Productivity in the AEC Industries in the United States for On-site and Off-site Activities.” Journal of Construction Engineering and Management 234[7]: 517-526) compared the labor productivity of off-site manufacturing of items used on construction projects (structural steel fabrication, precast concrete, curtain walls) with similar activities at the construction site. Using value added per employee, the Economic Census data showed that in all cases, off-site work is more labor efficient and more capital intensive. These results are exactly what you would expect and should lead to greater use of off-site fabrication in the future. This may involve some radical changes to the design and construction process, but, in my view, it also holds the best promise for significant improvements in the future.
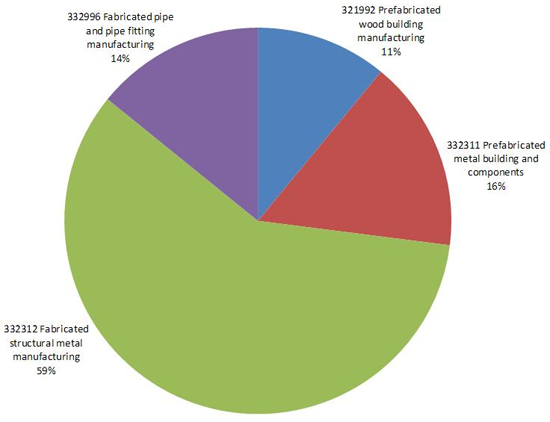
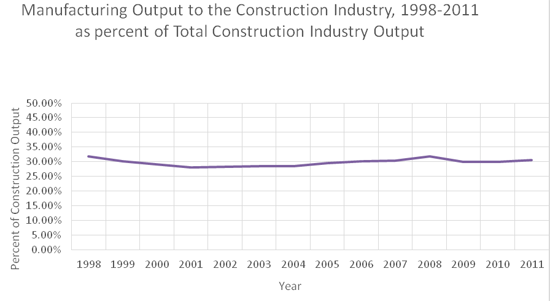
Figure 12 shows a breakdown of the major materials that are manufactured off-site and shipped to the site. Figure 13 shows that a relatively large percentage of construction industry input comes from the manufacturing industry. It is a surprisingly stable percentage (30% of total construction output) over the 1998-2011 time period.
Most recently, there has been increasing emphasis on finding better ways to identify, capture and move the data needed for FM systems (CAFM, CMMS, BAS) during the design and construction process so that it can be used by the owner at the completion of the building. The old approach of giving the owner reams of drawings and product manuals at turnover is not only wasteful, but requires that the FM staff spend months gathering data for systems that cannot be used until this process is completed. These FM management systems should be linked to as-built BIM models of the completed facility so that the 3D view of the facility is available to FM staff and future modifications of the building.
There are various approaches to achieve BIM FM integration and they will not be covered here as they are not relevant to labor productivity. However, they do impact the proper use of BIM by architects, engineers and contractors. This is an area where there are very significant owner benefits from improved FM business processes.
Based on the data collected about the Construction Industry by US Bureau of Labor Statistics and The Department of Commerce (Census Bureau) and additional analysis of this data by the Bureau of Economic Analysis, there can be little doubt that there are significant structural problems preventing improvements in labor productivity in this industry. Over the past fifty years, productivity has either slowly declined or remained stagnant. This is in contrast to all nonfarm industries (which includes construction) which have shown significant increases in labor productivity. This paper tries to identify some of these structural impediments and propose some opportunities for improved performance. To be realistic, I do not see significant changes over the coming 5 to 10 years because the problems seem quite intrinsic to the industry. There are, however, opportunities for improvements in specific areas of work and at the task level. Indeed, research into specific tasks has identified a number whose labor productivity have increased moderately over time (see Goodrum P., Haas C. Glover R., “The Divergence in Aggregate and Activity Estimates of US Construction Productivity.” Construction Management and Economics 20, no. 5: 415-423, published in 2002, and Goodrum P., Haas, C., “Long Term Impact of Equipment Technology on Labor Productivity in the U.S. Construction Industry at the Activity Level.” Journal of Construction Engineering and Management 130, no. 1:124-133, published in 2004). However, these improvements have not been sufficient to offset overall industry trends.
The major opportunities for positive change include better use of BIM enabled processes and procurement contracts that allow improved collaboration, design for constructability, greater use of prefabrication and use of virtual design and construction to support enhanced understanding, and efficiency. The industry needs to reduce its use of low-tech “stick built” approach and learn to take advantage of IT enabled practices closer to those used in the manufacturing industry.
I would like to thank Allison Huang, a former economist at NIST, for her extensive help in assembling the data needed to support this paper. Her background in the economics of the construction industry and knowledge of the data collected by government agencies was invaluable to me.
 Dr. Paul Teicholz was the Founding Director of the Center for Integrated Facility Engineering (CIFE) at Stanford University from 1988 to 1998. He is currently Professor (Research) Emeritus at the Dept. of Civil and Environmental Engineering, Stanford University, and also works as an independent consultant to the AEC industry and related service providers. Before his academic tenure at Stanford, Paul worked for over 25 years as a consultant and director of IT in the construction industry. He has won several academic and professional awards, including the Construction Management "Man of the Year" awarded by the American Society of Civil Engineers in 1985, and one of the most significant Innovators to "Technology and Materials" in the Construction Industry over the past 125 years, awarded by Engineering News Record magazine in 1999.
AECbytes content should not be reproduced on any other website, blog, print publication, or newsletter without permission.